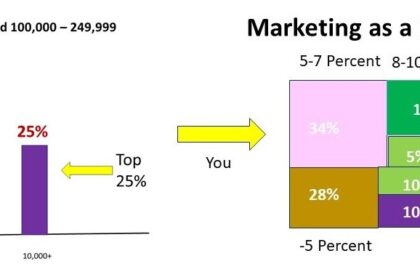
A dashboard with the 6 most vital statistics is now available. You can now find out where your program stands. Compare your program to the average. Even more importantly, compare your program to the Top 25% of programs. And compare your program’s stats to the LERN recommendation.
Your dashboard is by institutional setting, what we call Constituency. It is available for:
-Recreation Departments
-University continuing education
-Community education in public schools
-Community College continuing education
And it is also by your size of community. So you receive comparisons with similar organizations serving the same population size.
Data currently available include:
-Registrations
-Income
-Registrations compared to last year
-Cancellation rate
-Marketing budget
In 2024, you will also be asked for your Instructor and other production costs for the year. Future editions will include data specific to various functions, such as your brochure, email and home page.
It is free. All you have to do is go to lern.org/dashboard and give us your data.
You do not have to be a LERN member. We will tell you where you’re doing great and where you stand. Your individual program data will remain confidential. Other programs will only see the averages and cumulative data. The LERN Dashboard will move the field forward by leaps and bounds.
Questions? Email us at info@lern.org


